Conversion Rate Optimization: Turning Visitors Into Customers
You raised the ad budget, visitor numbers went up, and the order count stayed exactly where it was. Most online businesses hit this wall at some point, and the answer is usually not to buy more traffic.
Conversion rate optimization is the work of getting more orders out of the visitors you already have. The appeal is simple: doubling traffic is expensive, while fixing a leaking step in the funnel often costs nothing but attention.
What is conversion rate and how is it calculated?
The definition is easy: sessions that end in an order divided by total sessions in a period. How many out of a hundred visits end in a sale?
Looking at a single average, however, is misleading. On the same site, a visitor arriving from organic search behaves nothing like one arriving from a social ad, and desktop differs noticeably from mobile. So you want conversion rate in at least three breakdowns: channel, device and landing page.
Aiming at industry averages is another common mistake. The only benchmark that means anything for your business is your own history. Establish a three-month baseline first, and measure improvement against that. When setting up the measurement side, the event logic in our website analytics guide applies directly.
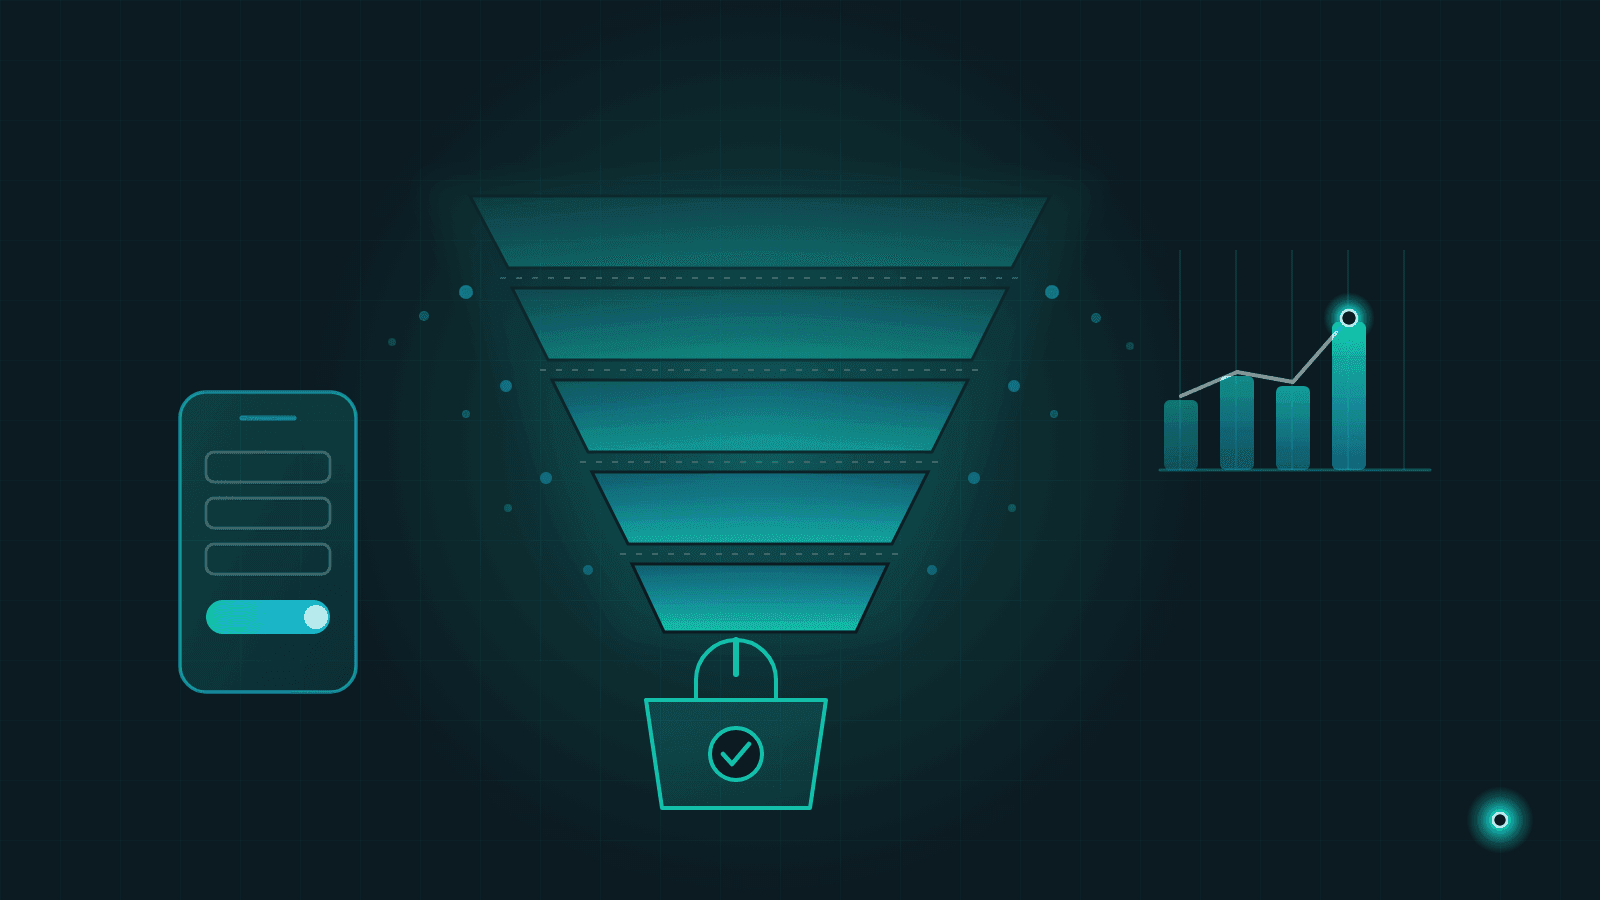
Measuring the funnel step by step
As a single number, conversion rate never tells you where you are losing people. The funnel steps do:
- Visit
- Product page view
- Add to cart
- Enter checkout
- Complete order
Write down the transition rate from each step to the next. Once the table exists, the problem usually announces itself. Plenty of product views but few add-to-carts points at the product, the price or the description. Plenty of carts but few entering checkout points at shipping and delivery uncertainty. Plenty entering checkout but few completing points at the form flow and payment options.
Cart and checkout: the most expensive losses
Industry research has measured cart abandonment at around seventy percent for years. Seven of every ten people who add something to a cart leave without completing the order. These are not idle visitors; they liked the product and reached the decision stage. That makes every point here worth more than a point at the top of the funnel.
The most common causes and what to do about them:
Surprise costs. If shipping, surcharges or extra service fees only appear at the final step, abandonment is guaranteed. Show the total as early as you can. If there is a free-shipping threshold, tell people on the product page how much more they need to add. Set that threshold with margin in mind — pricing strategy and margin analysis is a good frame for it.
Forced registration. Not being able to order without creating an account is one of the fastest ways to lose a first-time buyer. Enable guest checkout and offer the account afterwards.
Limited payment options. If the method a customer is used to is missing, the purchase does not happen. Alongside card payment, use your own data to see which of instalments, cash on delivery or digital wallets actually matter to your audience.
Vague delivery. "Will be dispatched shortly" does not build confidence. Give an estimated delivery date — which requires solid stock data behind it. If your inventory management is weak, so is your promise.
Mobile friction. Mobile carries a large share of traffic, yet filling in forms is always harder there. Reduce the number of fields, set the right keyboard types, simplify address entry.
Missing trust signals. Return conditions, visible contact details, genuine reviews and clear terms of sale all move conversion directly. We covered the rules currently in force around reviews and price display in new advertising and discount rules in e-commerce; compliance here is commercial as much as legal.
Small tests, one variable
The method in conversion work is measurement, not opinion. The common rule is plain: change one thing at a time, split visitors randomly between the two versions, and fix the duration in advance.
The most frequent mistake is stopping a test early. Declaring a winner after two days usually means reading noise. Take care as well not to move another variable — a campaign, a price, an ad budget — while the test runs.
If your traffic is too small for A/B testing, do not worry: on smaller sites the fastest gains come not from testing but from fixing the step that leaks most. Measure, find the worst transition, fix it, measure again.
A source as valuable as any test is the customer. One question to someone who did not complete an order — "what made you change your mind?" — can replace weeks of analysis. Recurring questions reaching customer service work the same way: delivery times, size charts, return conditions. That list of questions is a ready-made to-do list for conversion work.
Technical causes that get missed
Sometimes the problem is neither copy nor design, but infrastructure:
- Page speed. A product page that loads slowly, especially on mobile, loses the visitor before they see anything.
- On-site search. A visitor who cannot find what they searched for leaves. Report the queries that return no results; that list shows both your product and your content gaps.
- Stock and price inconsistency. If the price on the page differs from the price in the cart, trust ends instantly. For consistency across channels, see the disconnected-data problem in ERP, CRM and e-commerce integration.
- Broken measurement. Analytics with badly configured events pushes you to solve a problem you do not have, or to miss the one you do. Data quality is decisive here too.
Who are you optimizing for?
One last point: not all visitors are the same. Someone arriving for the first time needs different things from someone placing a third order. The first is looking for reassurance, the second for speed. You are not obliged to show them the same page in the same way.
Bringing the logic of customer segmentation into conversion work beats chasing an average conversion rate. Lead with returns and trust messaging for new visitors; shorten the path to a one-click repeat order for returning customers.
Where to start
Three steps. First, measure the five funnel stages over the last three months and mark the worst transition. Second, remove the top three friction points at that stage — surprise costs, forced registration, vague delivery and the like. Third, measure again in the same table and attach it to a view you look at regularly; following the principles in how to design an effective dashboard, three or four numbers are enough.
If you would like a view that measures your conversion funnel from your own data, or help tidying up your measurement setup, get in touch; you can also look through our services to see how we work.
Frequently Asked Questions
- What is conversion rate and how is it calculated?
- Conversion rate is the number of sessions that end in an order divided by total sessions in a period — how many out of every hundred visits turn into a sale. It becomes far more useful when broken down by channel, device and page, because a single average usually hides behaviours that have nothing in common.
- Why is cart abandonment so high?
- The most common causes are costs that only appear at checkout (shipping, surcharges), forced account creation, limited payment options, unclear delivery times and forms that get harder on mobile. Industry research has measured cart abandonment at around seventy percent for years, which is why even a few points of improvement shows up clearly in revenue.
- How do you run an A/B test?
- Change one variable at a time, split visitors randomly between the two versions, and do not stop the test before the duration or visit count you set in advance. Looking early and deciding early is the most common mistake in conversion testing. If you do not have enough traffic, fixing the step where the funnel leaks most will get you results faster than testing.
Need help with this topic?
Contact Us