What Is Business Intelligence and What Can It Do for You?

Month-end arrives, spreadsheets fly back and forth, and in the management meeting everyone is holding a different number. Sales quotes one revenue figure, accounting another, and working out which one is right becomes a project of its own. If this scene feels familiar, you are in good company — it plays out in most small and mid-sized businesses almost every month.
Business intelligence — BI for short — exists to fix exactly this. In this guide we answer what business intelligence actually is in plain language: how it differs from classic reporting, what a live dashboard really means, which steps a BI project goes through, and how to tell whether your company is ready for one.
What Is Business Intelligence?
In the simplest terms, business intelligence is the practice of bringing together the data scattered across your company — sales records, stock movements, bank accounts, customer information — and turning it into screens that update themselves and that everyone reads the same way.
The key point: BI is not a single piece of software; it is a way of working. There is a tool involved, of course, but what really changes is the answer to "who sees the numbers, when, and how." Data no longer lives in personal Excel files; it lives in a shared system. In that sense, BI is the most hands-on layer of data analytics: analytics looks for answers to business questions, while BI keeps those answers in front of you every day.
Reporting vs. BI: Looking Back vs. Seeing Now
"We already have reports" is the most common objection in any BI conversation — and a fair one. But a report and business intelligence are not the same thing.
A classic report is a photograph: last month's sales, last quarter's costs. It takes time to prepare, starts ageing the moment it is finished, and answers the question "what happened?"
Business intelligence is a live camera: it answers "what is happening right now?" and "where will we land by month-end at this pace?" That may sound like a small distinction, but it fundamentally changes how decisions get made. You see problems while they are happening, not after the month closes. If a critical product ran out of stock today, you find out today; if customer payments are starting to slip, you chase collections before the week is over.
We explored why a reporting culture alone often falls short in our piece on why data-driven decisions feel hard.
The Live Dashboard: A Control Panel for Your Company
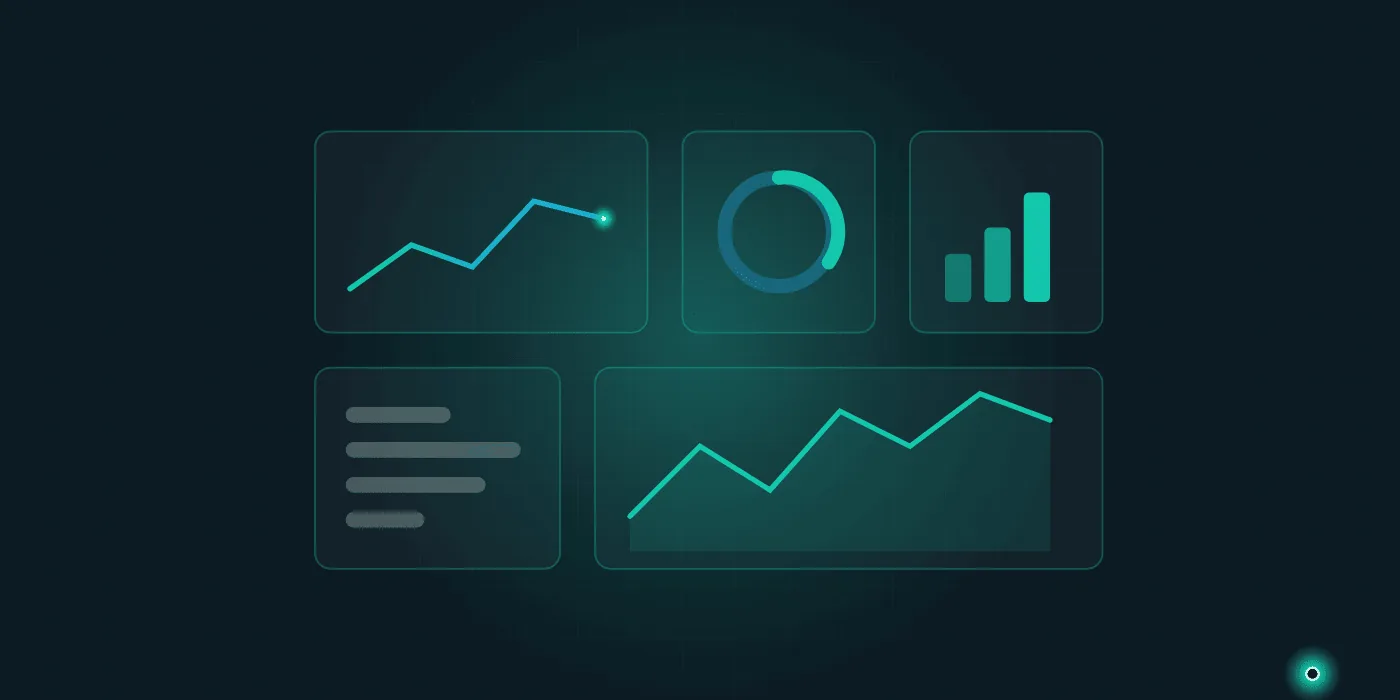
The most visible product of BI is the dashboard. Just as your car's instrument panel shows speed, fuel and engine temperature at a glance, a well-designed dashboard gathers your company's critical indicators on a single screen and refreshes itself as the data changes.
The goal of a good dashboard is not to show more data; it is to make sure everyone sees the same few numbers that actually matter.
Typical Metrics for SMEs
Priorities differ from company to company, but four areas show up on almost every SME dashboard:
- Revenue and sales: daily/monthly sales, distance to target, breakdown by product and channel
- Inventory: stock on hand, items below critical levels, slow-moving products
- Cash flow: expected collections, upcoming payments, net cash position
- Customers: new customers, repeat purchase rate, customers who haven't ordered in a while
Even these four windows gathered on one screen turn "how's business?" from a guess into a measurement.
The Steps of a BI Project
A BI project does not have to be a months-long software odyssey. Done in the right order, it is a series of small, manageable steps:
- Define the questions. Needs come before tools: list the 5–10 questions you look for answers to every day.
- Take inventory of your data sources. Accounting software, e-commerce panel, Excel files, CRM — which data lives where?
- Collect and clean the data. Sources are consolidated into a single structure; duplicates and errors are weeded out. For companies whose data still lives in scattered spreadsheets, this step usually goes hand in hand with moving beyond Excel.
- Design the dashboard. Few metrics, clear visuals: the first version should answer the most critical questions — polish can come later.
- Run a pilot and gather feedback. Test it against real decisions for a few weeks; remove charts nobody uses, add what is missing.
- Roll out and maintain. Involve the teams and review the metrics regularly. A dashboard needs care; the one that gets built and forgotten is the most expensive one.
If you would like to see how these steps play out in real companies, have a look at our projects.
Are You Ready? A Quick Checklist
Before starting with BI, run through this list. You don't need a "yes" on every item — but if most answers are "no," it is worth strengthening the foundations first:
- Our sales, inventory and finance data is kept digitally and consistently
- Every critical figure has a single source of truth — the same number doesn't take two different values in two different places
- As a manager, I can name the indicators I want to track regularly
- At least one person on the team will own the data
- We are prepared to act on the numbers even when we don't like them
The last item matters most. BI makes the numbers visible; without the resolve to face them, even the best dashboard becomes wall decoration.
How to Think About Return on Investment
"What will BI actually earn us?" varies from industry to industry, so rather than quoting a ready-made percentage, it is more honest to offer a logic you can run with your own numbers. Look at three items:
Time recovered. Count the hours currently spent building reports: who, how often, how many hours? BI automates most of that work, and you can price the freed-up time straight from your own payroll.
Errors prevented. Every company's own history records what mis-copied data, late-noticed stock-outs or delayed collections have cost. Even a rough tally of last year's incidents is illuminating.
Faster decisions. The hardest to measure, often the most valuable: spotting an opportunity or a problem weeks earlier. Putting a precise number on it is difficult, but "what were the last three opportunities we missed because we were late?" is a good place to start.
Put the sum of those three next to the cost of the project, and the decision usually makes itself.
Business intelligence is not a luxury; set up properly, it is a practical tool that proves itself through daily use. The healthiest way to begin is a small pilot limited to one department or a handful of critical metrics: see it work, build trust, then grow it.
If you would like to talk through where BI could start in your company, take a look at our data analytics and business intelligence services or reach out directly through our contact page. We listen first and map out a route that fits you — no sales pressure.
Need help with this topic?
Contact Us